Almost two years ago, we published a blog post about how we expanded WarpStream from a single region to multiple, while still presenting it as a single pane of glass. Since then we’ve added a lot more regions.
The reason for this is simple: WarpStream customers want control planes as close as possible to their workloads, ideally in the same cloud region. As a result, we have WarpStream control planes in 24 unique regions across three different cloud providers.
Why do customers care which region their WarpStream control plane is running in? The obvious answer would be latency, but that’s only a small part of the story. The much more important reason is about reliability and alignment of failure domains. For example, someone running all their services in AWS us-east-1 shouldn’t have to worry about how their workload will be impacted if GCP has an outage in any region.
And last but not least, some customers want to be completely isolated from others, and are asking for what we call “dedicated control planes”. Under the hood, it means that the customer is using a completely separate infrastructure - from the load balancer to the control plane containers.
All of this is to say that since we wrote that first blogpost we went from running WarpStream’s control plane in 4 AWS regions to 24 regions across 3 different cloud providers. Like the Agents, WarpStream’s control plane is completely stateless and offloads a lot of the trickier operational problems to cloud provider primitives like DynamoDB and Spanner, so operating this many control plane regions is really not that much of a burden for our team. The control plane mostly just works and we rarely get paged or have to perform manual operations.
While operating this many control planes is pretty manageable, deploying this many control planes is a completely different story. In this blogpost, we are going to explain how we managed to get there without introducing too much friction for our engineering team, without deploying any overly-complicated technology, and without hiring a dedicated dev-ops or infrastructure team (despite my lobbying for it!). We will also take the opportunity to explain our infrastructure layout, and how we try to deploy slowly and safely any change.
Before we get into the specifics of multi-regions, let’s take a step back and explain the high level architecture of our control plane regions. Generally speaking, we refer to a deployment of WarpStream’s control plane as an “environment” (an environment is the same thing as a “cell” if you’re familiar with that terminology instead).
A given cloud provider region can have one or more WarpStream environments:

Each environment is completely isolated from the others and they have no awareness of each other or ability to communicate with each other. Each environment is fully isolated all the way down from the ingress load balancers to the backing storage, as well as everything in-between.
.png)
In each environment, we run three separate “zonal” Kubernetes clusters, one per availability zone.

Let’s pause here for a second because that’s pretty different from what most people do. We decided to deploy three different “zonal” Kubernetes clusters, with all resources in that Kubernetes cluster located in a single availability zone, instead of deploying a single multi-AZ regional cluster. We chose this model for a few reasons:
The last missing piece we need to explain is that in addition to our primary control plane service, each environment also runs a “control plane shadow” service. The shadow service is used to test new versions of the control plane service by dual-processing a percentage of all production traffic on the new version and making sure it generates the exact same output as the previous version.
A simplified version of the flow looks like this:

We could write an entire blog post about the shadowing service so we won’t go into further detail here, but one point we’d like to belabor is that the shadow service is not a canary. Customer Agents always receive a response generated by the actual control plane service. This is important, because it means we can detect regressions in production without impacting any customers.
When we have a new control plane image to rollout, we always deploy the shadow service first. Any discrepancy between the shadow service and the real control plane service responses triggers an alert in our observability platform. Of course we have the ability to bake into the shadow service some “known discrepancies” when we roll a change that actually changes the response, so only unexpected differences page the engineering team.
OK, now that we’ve laid the scene, we can finally talk about deployments. The first generation of our deployment tooling was just a Go program that ran on an engineer’s laptop and orchestrated a simple flow of:
This was suboptimal for a number of reasons, not least of which was that an engineer who started a deployment on a Friday afternoon but then allowed their laptop to go to sleep could inadvertently cause a production code rollback when they woke their laptop up on a Monday morning. Before you judge us too harshly, remember that this was back when the entire engineering department was 4 people (including the founders!) and the product didn’t even have a way to charge customers yet!
Obviously this wasn’t good enough, so before we GA’d the product we rewrote all of our deployment tooling with a number of important changes:
The “UX” of this new tool heavily relied on Slack: all deployments created a dedicated Slack thread, and the tooling posted regular updates as the deployment progressed. There was also a direct link to the GitHub Action if anyone wanted to cancel it. In order to be able to correlate deployments with other signals, our script would publish logs & metrics to our observability provider.
For example, this is what it looked like when we deployed an internal service to a staging environment:

Under the hood, a deployment consists of:
When you factor in the shadowing service, “deploying” the control plane to an environment consists of:

This new tooling was much better, safer, and served us well for a really long time.
Now that you are more familiar with how our services are deployed towards a single region, let’s take a peek at what it means when we started to expand WarpStream’s footprint all over the world.
When we started increasing the number of WarpStream regions, one thing became very clear: it wasn’t practical to require that every engineer slow roll every change they made through all of our production regions. We’d either have to make deployments run faster than we were comfortable with, or our engineers would only ever be able to deploy at most once per day, neither of which were acceptable.
As a result, we decided that we would use a deployment train strategy where engineers would merge their changes and then deploy them to a single region henceforth referred to as “the primary”. There is nothing special about the primary region other than the fact that it's the region that receives new changes first (after they’re promoted through our staging and shadow environments first, of course).
New code would bake in the primary region overnight, and every morning an automated train would run that would query our observability system to determine which commit had been running in the primary region overnight, and then promote that version to all of our remaining production regions one at a time.
While this may sound complicated, the implementation was quite simple (a few hundred lines of Go). It was basically just a matter of taking our existing deployment tooling and throwing it into a for loop.
We scheduled a run of this train each business day at noon UTC inside a GitHub Action, and let it run. Just like regular deployments, it would create a thread in Slack, leaving messages at each step so we could monitor the progress.
Life was good - for a while: the engineering team was mostly unaffected by the new regions and the rate at which they were growing. Engineers would merge their changes and then deploy them to the primary region. And every day, we would run a train to “sync” the other regions. Of course, people still had to change their habits a bit:
Eventually as the number of regions grew to twenty and beyond, the train became a frequent source of flakiness. The longer a given train took, the more time there was for things to go wrong:
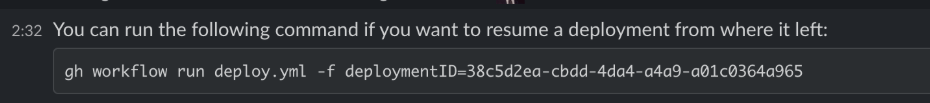
We could restart the train, but all the state for the current train was stored in the processes memory which would be lost when it failed. We could “fast-forward” through completed steps on restart, and we even experimented with some small tricks like persisting the current processes state in DynamoDB on a regular basis and reloading it on restart.
This allowed us to make it easy to resume a train that stopped or failed for any reason:
But there were other issues. For example, GitHub Actions have a hard-coded maximum duration of six hours, but once we got past 20 regions, deploy trains took longer than that. That wasn’t a limitation of our deployment model either, we want production deployments to be slow so that we only ever update a single region at a time and our automated shadowing and monitor gates have time to catch issues between deployments to regions and individual availability zones.
We also ran into other pain points like the fact that implementing relatively simple features like: “pause deploy trains outside of engineering business hours” and “deploy this financial trading firm's dedicated control plane outside of US trading hours” became unnecessarily difficult and painful with this approach.
Our deployment tooling had grown from a 100-line Go program to a complex beast that was becoming more and more difficult to maintain. In addition, deployment train paper cuts were really starting to add up in terms of wasting engineering hours. Eventually, we decided that we’d accumulated enough technical debt and achieved sufficient scale that we needed a new solution.
At this point, we did consider leveraging open source or off-the-shelf tooling, but every tool we investigated seemed unnecessarily complex relative to our needs, and more importantly, we liked having complete control over our deployment tooling. As an infrastructure provider, our ability to roll out changes to dozens of unique environments and regions running complex and stateful software is extremely core to our business and we wanted to maintain full control of that process.
As a result, we settled on doing a full rewrite of the deployment tooling: trains v2! Starting from first principles, we decided to use a completely different architecture for our trains v2 implementation: async reconciliation. Reconciliation loops are one of our favorite distributed systems patterns, and we’ve discussed them extensively in other blog posts like the ones we wrote about Schema Linking and Object Storage Garbage Collections.
The high level design we ended up using is the following:
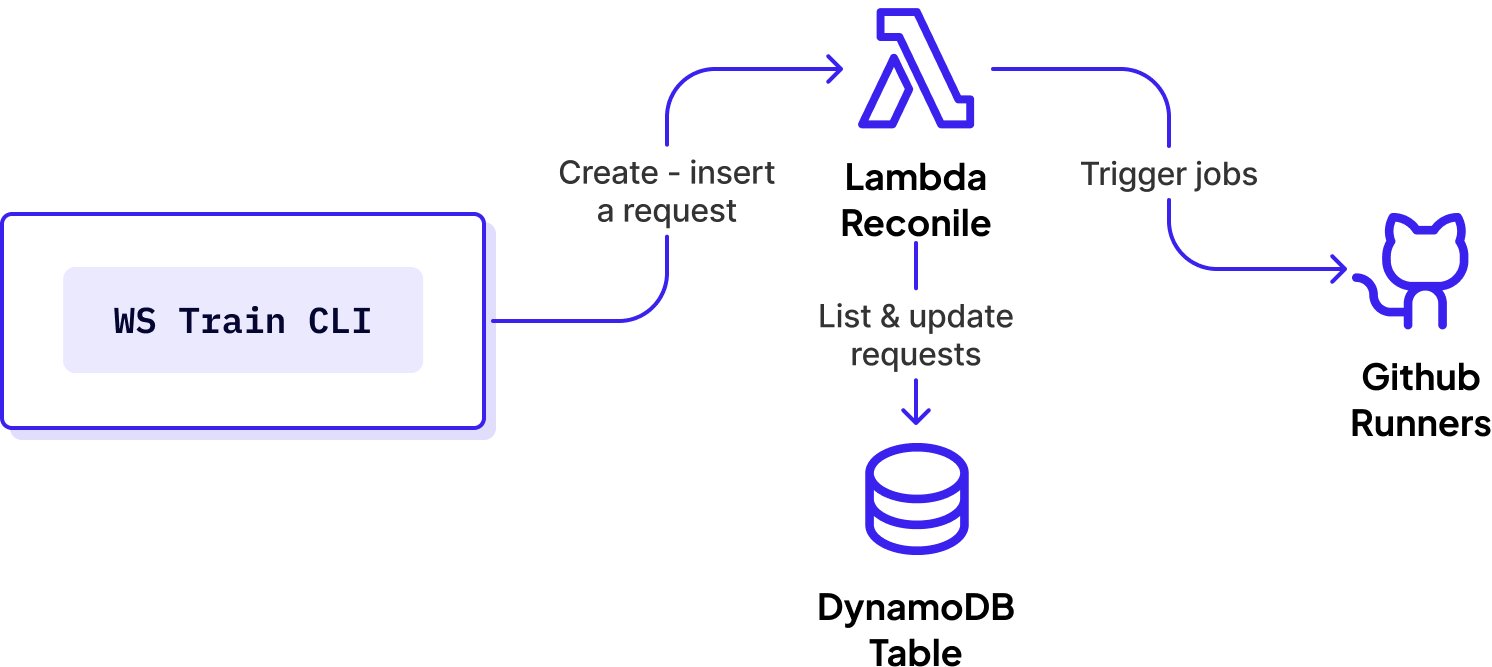
This is a classic reconciliation loop. The target state is defined by using a user who specifies an operation like: “deploy version X to service FOO in all production environments” and the CLI tooling converts that to an ordered list of target states and stores them in a DynamoDB table. A background lambda runs periodically, checks the status of each environment against what it’s supposed to be in the DynamoDB table, and kicks off GitHub runners to reconcile any differences.
This new architecture was not that different from what we previously had, so it didn’t take long to start submitting our first trains with this new framework.
With this new design, it was much easier to implement new features and quality-of-life improvements. For example, making it so deploy trains pause automatically outside of business hours was just a few lines of code in the new implementation. The reconciliation lambda just needs to check if the current time is within business hours at the beginning of each reconciliation loop, and if it's not, do nothing.

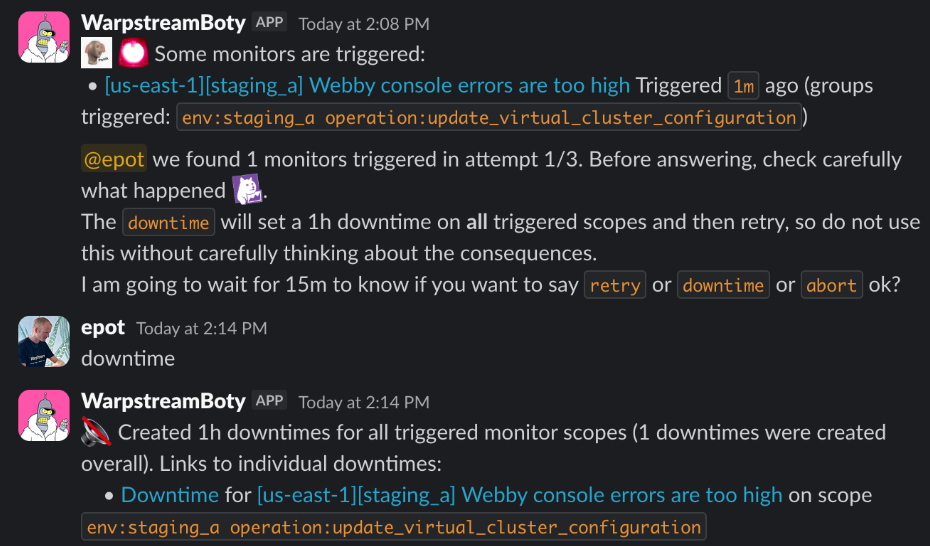
Consider another quality-of-life improvement that was very difficult to support in trains v1, but trivial in v2: a deploy train is interrupted by a failing monitor gate. You investigate, assess the impact, and decide that it was either a flake or unrelated to your deployment so you want to move forward. The only thing you have to do is to respond to a Slack thread and the train system takes care of the rest. It will automatically put an appropriate downtime on the monitor, check that nothing else is triggered, and continue the deployment:
Another pain point in our setup was how we handled infrastructure changes. We have always been keen on keeping a human on the loop when it comes to provisioning critical infrastructure: Kubernetes clusters, load balancers, databases … everything needed to deploy our control plane all over the world. This meant that in practice that after going through the regular code change process - pull request/review/merge - the terraform apply step would be performed carefully by an engineer who would triple check the plan before applying. This worked fine when we only had a few regions, but as the number of regions grew it became quite painful to roll out even simple changes - like adding a tag - across all of our regions.
Luckily we took this into account when we were designing Trains v2, so it was very easy to reuse the existing framework to automate the process of rolling out a terraform change across dozens of regions. This also enabled us to apply more targeted changes (like changes only impacting our Kubernetes clusters) on a zone-by-zone basis and take advantage of all the other features built into the Trains functionality like automated monitor gating.

We even built some advanced “plan comparison” logic into the terraform trains functionality so that if the plan for a new region was identical to the plan for a previously-approved region (with the only difference between the two plans being the name of the region that the change was being applied to) the Terraform apply could proceed without an additional human review.
Our infrastructure isn't static, so keep an eye on our blog for future updates about its evolution. You can subscribe to our newsletter to get blogs delivered to your inbox.
