When teams run Kafka at scale, "who did what, and when?" becomes a vital question that needs an answer. A topic gets deleted, a consumer group disappears, or a new ACL shows up, and nobody knows who made the change. In regulated industries, that gap isn't just inconvenient, it can be a compliance violation. Even outside of compliance, the absence of a reliable audit trail makes incident response slower and root-cause analysis harder.
Today we're releasing Audit Logs for WarpStream, giving you a complete, structured record of every authentication action, authorization decision, and platform operation across your clusters.
Most Kafka operators are familiar with the pain. Kafka itself provides limited built-in auditing. You can piece together some information from broker logs, but those logs are unstructured, scattered across brokers, and not designed for long-term retention or compliance. Building a proper audit trail on top of vanilla Kafka typically means stitching together log aggregation pipelines, parsing free-text log lines, and hoping nothing falls through the cracks.
With WarpStream, because all metadata flows through the hosted control plane, we can expose a centralized view of every operation that occurs across your clusters. The logs are structured, queryable, and consumable using the tools you already know.
Audit Logs capture two broad categories of events:
Every event follows the CloudEvents spec and conforms to the same schema used by Confluent Cloud Audit Logs, so if you already have tooling built around that format, it works out of the box.
WarpStream Audit Logs aren't just written to a database somewhere. They're produced into a fully-managed WarpStream cluster running on WarpStream's own cloud infrastructure. That means you can consume your Audit Logs using the Kafka protocol, with any Kafka client, and export them anywhere: your SIEM, a data lake, an Iceberg table via Tableflow, and more.
This approach gives you the best of both worlds. You get a built-in UI in the WarpStream Console for browsing and searching audit events directly, and you also get the full power and flexibility of the Kafka ecosystem for building whatever downstream integrations your compliance or security team needs.
To get started consuming Audit Logs programmatically, just navigate to the Audit section of the Console, create SASL credentials under the "Credentials" tab, and use the connection details from the "Connect" tab. It's the same workflow you'd use to connect any Kafka client to any WarpStream cluster.
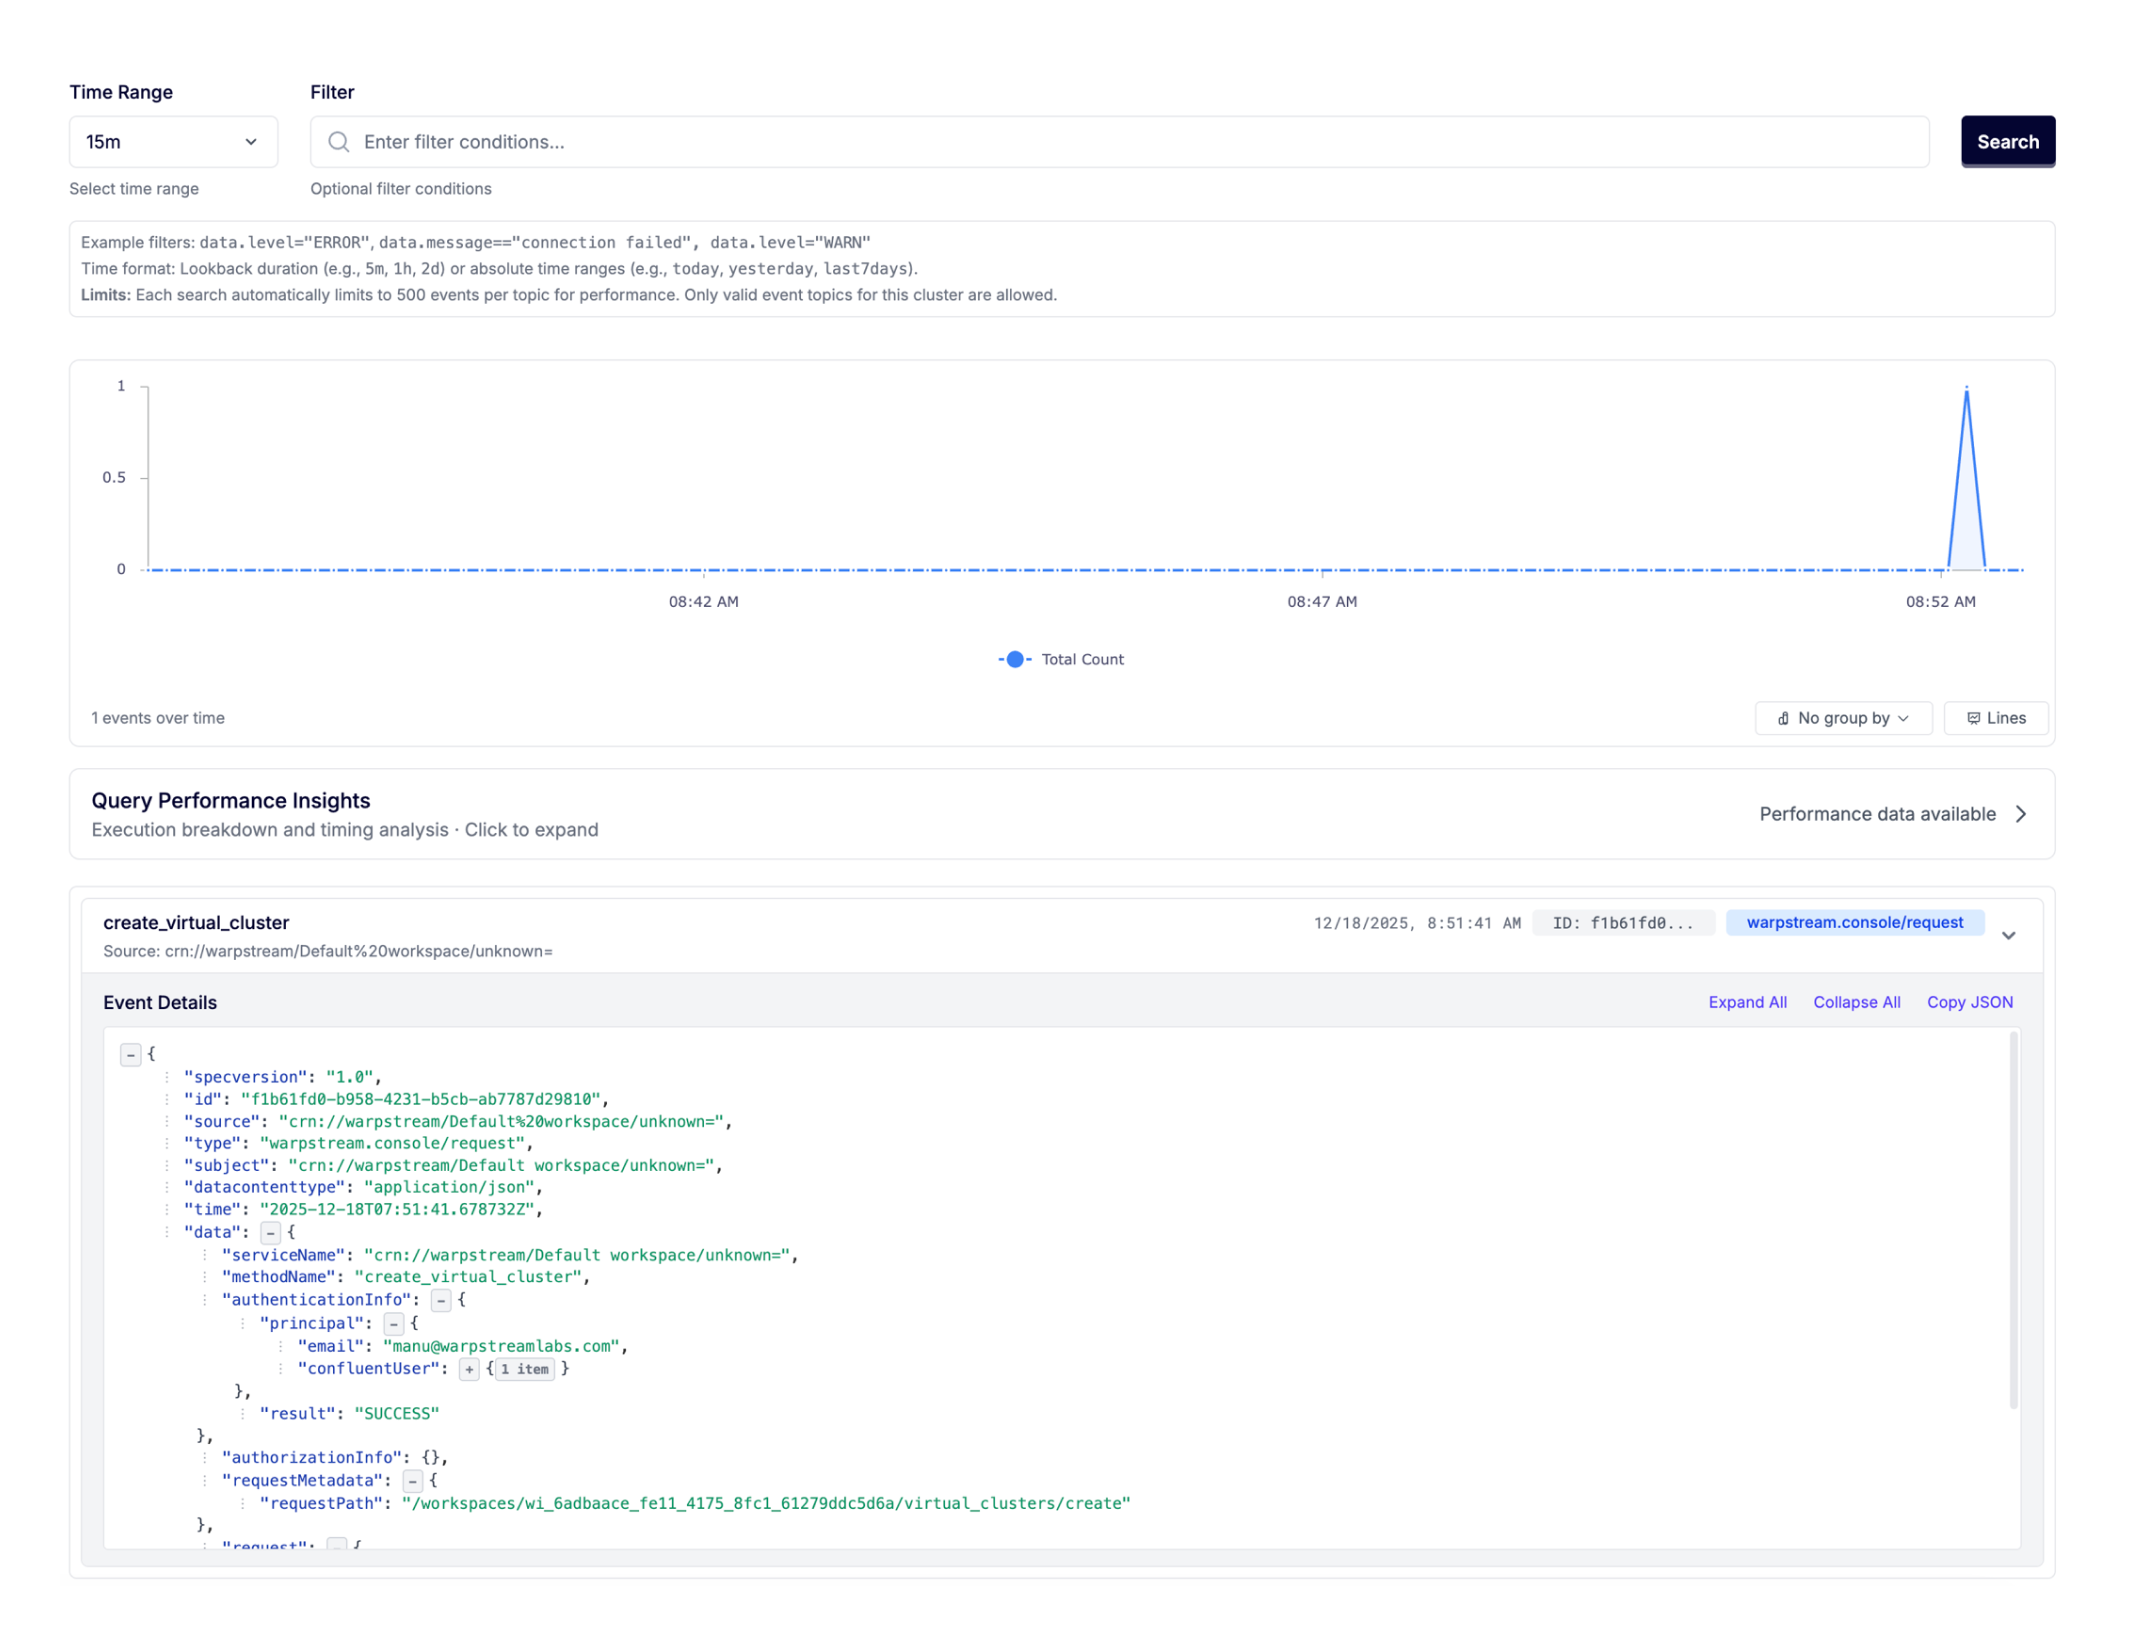
Each audit log event is a structured JSON payload. Here's a simplified example of what you'd see when a client creates a topic:
The event tells you exactly what happened (a topic was created), who did it (which credential was used), when it happened, and what the outcome was. Failed operations are logged, too. If a <span class="codeinline">DeleteGroups</span> call fails because the group doesn't exist, you'll see the error code and message in the result, which is invaluable for debugging client issues or spotting misconfigured applications.
Platform-level events follow the same structure.
Note that the Audit Logs events still only contain metadata. No data is egressed from your WarpStream clusters, and no access is delegated to WarpStream. The hosted cluster is simply a convenient interface that we expose so that you don’t have to deploy and manage another BYOC cluster in order to store and retrieve your Audit Logs.
Because the Audit Logs cluster is hosted on WarpStream's infrastructure rather than in your cloud account, billing works slightly differently than for BYOC clusters. It's metered across four dimensions: uncompressed data written, storage (GiB-minutes), network ingress, and network egress.
For the vast majority of use cases, Audit Logs are inexpensive. Most clusters produce well under 500 GiB/month of audit log data, which translates to less than $10/month for writes. Storage and networking charges are similarly modest. You can find the full pricing breakdown in our docs.
Audit Logs are available today for all WarpStream accounts on Pro or Enterprise clusters. To enable them:
Once enabled, logs start flowing immediately. No additional configuration, sidecar processes, or log aggregation pipelines need to be built.
