WarpStream’s BYOC architecture gives users the data governance benefits of self-hosting with the convenience of a fully managed service. Events are a new observability tool that take this convenience one big step further.
When we initially designed WarpStream, our intention was for customers to lean on their existing observability tools to introspect into WarpStream. Scrape metrics and logs from your WarpStream Agent and pipe them into your own observability stack. This approach is thorough and keeps your WarpStream telemetry consolidated with the rest. It works well, but over time we noticed two limitations.
We realized that to truly make WarpStream the easiest to operate streaming platform on the planet, we needed a way to:
Events address all three of these issues by storing high-cardinality events data, i.e. logs, in WarpStream, as Kafka topics, and making these topics queryable via a lightweight query engine.
Events also solves an immediate problem facing two of our more recent products: Managed Data Pipelines and Tableflow which both empower customers to automate complex data processing all from the WarpStream Console. These products are great, but without a built-in observability feature like Events, customers who want to introspect one of these processes have to fall back to an external tool, and switching from the WarpStream console adds friction to their troubleshooting workflows.
We considered deploying an open-source observability stack alongside each WarpStream cluster, but that would undermine one of WarpStream's core strengths: no additional infrastructure dependencies. WarpStream is cheap and easy to operate precisely because it's built on object storage with no extra systems to manage. Adding a sidecar database or log aggregation pipeline would add operational burden and cost.
So we decided to build it directly into WarpStream. WarpStream already has a robust storage engine, so the only missing piece was a small, native query engine. Luckily, many WarpStream engineers helped build Husky at Datadog so we know a little something about building query engines!
This post will have plenty of technical details, but let’s start by diving into the experience of using Events first.
Events is a built-in observability layer capturing structured operational data from your WarpStream Agents so you can search and visualize it directly in the Console. No external infrastructure is required: the Events data is simply stored as Kafka topics using the same BYOC architecture as WarpStream’s original streaming product. Here's a quick example of how you might use it.
Suppose you've just configured a Warpstream Tableflow cluster to replicate an 'Orders' Kafka topic into an Iceberg table, with an AWS Glue catalog integration so your analytics team can query the Iceberg tables data from Athena (AWS's serverless SQL query engine). A few hours in, you check the WarpStream Console and everything looks healthy. Kafka records are being ingested and the Iceberg table is growing. But when your analysts open Athena, the table isn't there.
You navigate to the Tableflow cluster in the Console and scroll down to the Events Explorer at the bottom of the table's detail view. You search for errors: <span class="codeinline">data.log_level == "error"</span>.
Alongside the healthy ingestion events, a parallel stream of <span class="codeinline">aws_glue_table_management_job_failed</span> events appears, one every few minutes since ingestion started. You expand one of the events. The payload includes the table name, the Glue database, and the error message:
The IAM role attached to your Agents has the right S3 permissions for object storage, which is why ingestion is working, but is missing the Glue permissions needed to register the table in the catalog. You update the IAM policy, and within minutes the errors are replaced by an <span class="codeinline">aws_glue_table_created</span> event. Your analysts refresh Athena and the table appears.
The data was safe in object storage the entire time, the Iceberg table was healthy, only the catalog registration was failing. Without Events, you would have seen a working pipeline on one side and an empty Athena catalog on the other, with no indication of what was wrong in between. The event payload pointed you directly to the missing permission.
Events are consumable through the Kafka protocol like any other topic, but raw <span class="codeinline">kafka-console-consumer</span> output isn't the most pleasant debugging experience. The Events Explorer in the WarpStream Console provides a purpose-built interface for exploring, filtering, and aggregating your events.
.png)
.png)
The top of the Explorer has four inputs:
Results come back as expandable event cards showing the timestamp, type, and message. Expand a card to see the full structured JSON payload. Following the CloudEvents format, application data lives under <span class="codeinline">data.*</span>.
The timeline charts event volume over time, making it easy to spot patterns, for example an error spike after a deploy, periodic ACL denials, a gradual uptick in pipeline failures. You can group by any field in each event’s payload. Group Agent logs by <span class="codeinline">data.log_level</span> to see how the error-to-warning ratio shifts over time, or group ACL events by <span class="codeinline">data.kafka_principal</span> to see which service accounts generate the most denials.
You'll also find Events Explorer widgets embedded in the ACLs and Pipelines tabs. These provide tightly scoped views relevant to the current context. For example, the ACLs widget pre-filters for ACL events, and the Pipelines widget only shows events generated by the current pipeline.
.png)
WarpStream Agents run in your cloud account and read/write directly to your object storage. Events fit right into this model. Event data is stored as internal Kafka topics, subject to the same encryption, retention policies, and access controls (ACLs) as any other topic. Importantly, Events queries run in the Agents directly, just like Kafka Produce and Fetch requests, so you don’t have to pay for large volumes of data to be egressed from your VPC.
Query results do pass through the control plane temporarily so they can be rendered in the WarpStream Console, but they aren’t persisted anywhere. In addition, the Events topics themselves are hard-coded to only contain operational metadata such as Agent logs, request types, ACL decisions, and Agent diagnostics. They never contain your topics' actual messages or raw data.
Events contribute to your storage and API costs just like any other topic data persisted in your object storage bucket, but we've specifically tuned Events to be cheap. For moderately sized clusters, the expected impact is less than a few dollars per month.
If cost is a concern, i.e. for very high-throughput clusters, you can selectively disable event types you don't need, for example, keeping ACL logs and turning off Agent logs. You can also reduce each event type’s retention period below the 6-hour default.
To put it bluntly, we bolted a query engine onto a distributed log that stores data in a row-oriented format. The storage layer is not columnar, which means we're never going to win any benchmark competitions. But that's okay. Our Events product doesn't need to be the fastest on the market. It just needs to support infinite cardinality and be fast enough, cheap enough, and easy enough to use that it makes life easier for our customers. And that’s what we built.
When you submit a query through the Events Explorer, it gets routed to one of your Agents as a query job. The Agent then:
For now, a single Agent executes the entire query, though the architecture is designed to distribute tasks across multiple Agents in the future.
The core challenge is that queries are scoped to a time range, but data in Kafka is organized by offset, not timestamp. While WarpStream supports <span class="codeinline">ListOffsets</span> for coarse time-to-offset translation, the index is approximative (for performance reasons), and small time windows like "the last hour" can still end up scanning much more data than necessary.
The query engine addresses this with progressive timestamp pruning. As tasks complete, the engine records the actual timestamp ranges observed at each offset range. We call these timestamp watermarks. These watermarks are then used to skip pending tasks whose offset ranges fall entirely outside the query's time filter.
.png)
The pruning works in both directions:
To maximize pruning effectiveness, tasks are not scheduled sequentially. Instead, the scheduler uses a golden-ratio-based spacing strategy (similar to Kronecker search and golden section search) to spread early tasks across the offset space, sampling from the middle first and then filling in gaps. This maximizes the chances that the first few completed tasks produce watermarks that eliminate large swaths of remaining work.
On a typical narrow time-range query, this pruning eliminates the majority of scheduled tasks and allows us to avoid scanning all the stored data.
The query engine reads data using the Kafka protocol, fetching records at specific offset ranges just like a consumer would. But in the normal Kafka path, data flows through a chain of processing: the Agent handling the fetch reads from blob storage (or cache), decompresses the data, wraps it in Kafka fetch responses, compresses it for network transfer, and sends it to the requesting Agent, which then decompresses it again (learn about how we handle distributed file caches in this blog post). Even when the query is running on an Agent that is capable of serving the fetch request directly, this involves real network I/O and redundant compression cycles.
The query engine short-circuits this with a direct in-memory client. It connects to itself using Go's <span class="codeinline">net.Pipe()</span>, creating an in-memory bidirectional pipe that looks like a network connection to both ends but never hits the network stack. On top of that, the direct client signals via its client ID that compression should be disabled, eliminating the compress-decompress round entirely. Additionally, this ensures that the Events feature always works, even when the cluster is secured with advanced authentication schemes like mTLS.
These two optimizations–in-memory transport and disabled compression–more than doubled the data read throughput of the query engine in our benchmarks. Is it faster than a purpose-built observability solution? Absolutely not, but it’s cheap, easy to use, adds zero additional dependencies, and is integrated natively into the product.
Events is designed as an occasional debugging tool, not a primary observability system. To make sure queries never impact live Kafka workloads, several safeguards are in place:
Beyond pruning and the direct client, the query engine applies several standard techniques:
Events launches with three data streams:
We plan to add new data streams over time as we identify more areas where built-in observability can make our customers' lives easier.
The same infrastructure that powers Events also drives WarpStream's Audit Logs feature. Audit Logs track control plane and data plane actions–Console requests, API calls, Kafka authentication/authorization events, and Schema Registry operations–using the same CloudEvents format. They are queryable through the Events Explorer with the same query language and enjoy the same query engine optimizations.
The only difference is that in the audit logs product, the WarpStream control plane hosts the Kafka topics and query engine because many audit log events are not tied to any specific cluster.
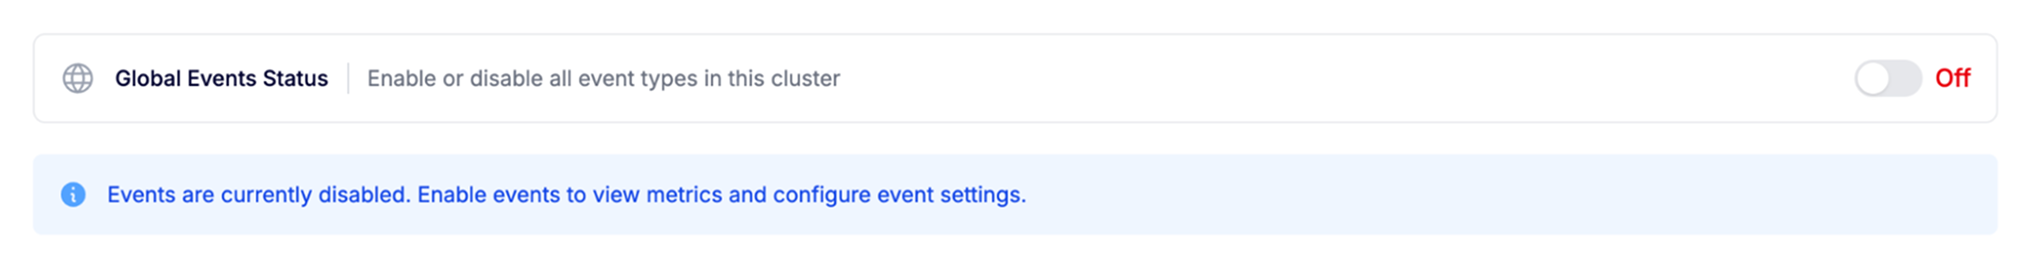
Events are available now for all WarpStream clusters. To enable them, you'll need to upgrade your Agents to version v779 or later. Once your Agents are updated:
The global status and individual event types can be toggled on and off via the API or the Terraform provider.
Event topics have a default retention of 6 hours. Retention and partition count are configurable per event type. Find these details and more in the Events Explorer’s public documentation page.