Serverless products and usage based billing models go hand in hand, almost by definition. A product that is truly serverless effectively has to have usage based pricing, otherwise it’s not really serverless!
But usage based billing systems are notoriously difficult to build. In order to maintain maximum flexibility, a well designed usage based billing system should separate “events” from “metrics”. In practice, this means that the system often needs to ingest, store, and make queryable huge volumes of time series event data so that the billing logic can be updated after the fact, without modifying how the underlying data is produced and stored. In addition, you need the ability to update pricing, provide custom pricing to individual customers, add products to your portfolio, and manage the customer lifecycle. And all of this has to be auditable, with strict controls on who can make changes and how those changes take effect.
If you’re not already familiar, WarpStream is a drop-in replacement for Apache Kafka that is built entirely on object storage. Our engineering organization prefers to spend its time on solving core problems for our users, so we decided to partner with Orb to process our billing events and administer the actual usage-based billing system for us.
We signed a contract with Orb, told them which dimensions we wanted to bill on, and then got back to working on our product roadmap.
Just kidding! There’s a bit more to usage based billing than that. Orb did allow us to offload most of the hard problems, like: event ingestion, processing, and storage, as well as the actual billing logic. However, before Orb could help us with all of that, we still had to figure out how to efficiently measure these dimensions in our code so we could submit billing events to them in the first place!
We came up with a really simple usage-based pricing model that only depends on 3 dimensions (one of which is essentially fixed):
1. “Cluster Minutes”, a fee for an "active cluster" (processes any requests), billed in 15-minute increments
2. Write throughput (GiB/s)
3. Storage (GiB hours)
Luckily, our control plane metadata store was already tracking write throughput, so we came up with a relatively straightforward solution. Periodically, we query the control plane metadata store for each cluster, aggregate the statistics into 15 minute intervals, and then submit time series billing events to Orb. This was easier than it sounds because our metadata store already has a time series engine built into it. The time series engine pulls double duty by populating various time series views in our developer console, and by powering the "timestamp" index for our Kafka protocol implementation.
Below is an example of a time series event we generated in anticipation of sending it to Orb:
We only emit a single metric for now (bytes_written_uncompressed), but this data model allows us to add additional billable dimensions in the future without having to increase the number of events that we send.
The most interesting thing about this event structure is the “idempotency_key”. This is a feature that Orb provides that enables them to automatically deduplicate submitted events with identical idempotency keys. We took advantage of this by structuring our time series events such that the background process which queries our metadata store and submits events doesn't have to be overly precise. It can crash or restart at any moment and always err on the side of re-submitting events, and the idempotency key makes sure that the customer isn’t double billed.
Of course, it would be wasteful for the billing scraper to resubmit all time series events for a cluster from the beginning of time every time it restarts, so we built a mechanism to “checkpoint” our progress. This was simple to implement, all we had to do was keep track of the last successfully submitted time series interval for each billing dimension in the Metadata store itself. However, Orb’s idempotency functionality means this was just an optimization for us, not a requirement for correctness.
The time series events took care of the write throughput dimension, but we still needed to meter the “cluster minutes” and “GiB hours” dimensions. We could have used the write throughput to determine if a cluster was “active” during each 15 minute interval, but a cluster could be “active” even if it wasn’t receiving writes. Instead, we decided to create a new “cluster_heartbeat” event type that was emitted periodically by the metadata store itself:
If a cluster wasn’t active during a given time period, we just submit a 0 value for the compute_minutes dimension, or simply don't submit the event at all if the stored_byte_minutes dimension is also 0.
With these two events in place, we had the ability to do full usage-based metering for all the dimensions of our "Bring Your Own Cloud" (BYOC) product. Success!
Of course, we weren’t done yet. In addition to WarpStream’s BYOC product, we also offer a fully serverless product. The difference between the two is that in the BYOC product, the Agents (data plane) run in the customer’s cloud account, and in the serverless product they run in ours.
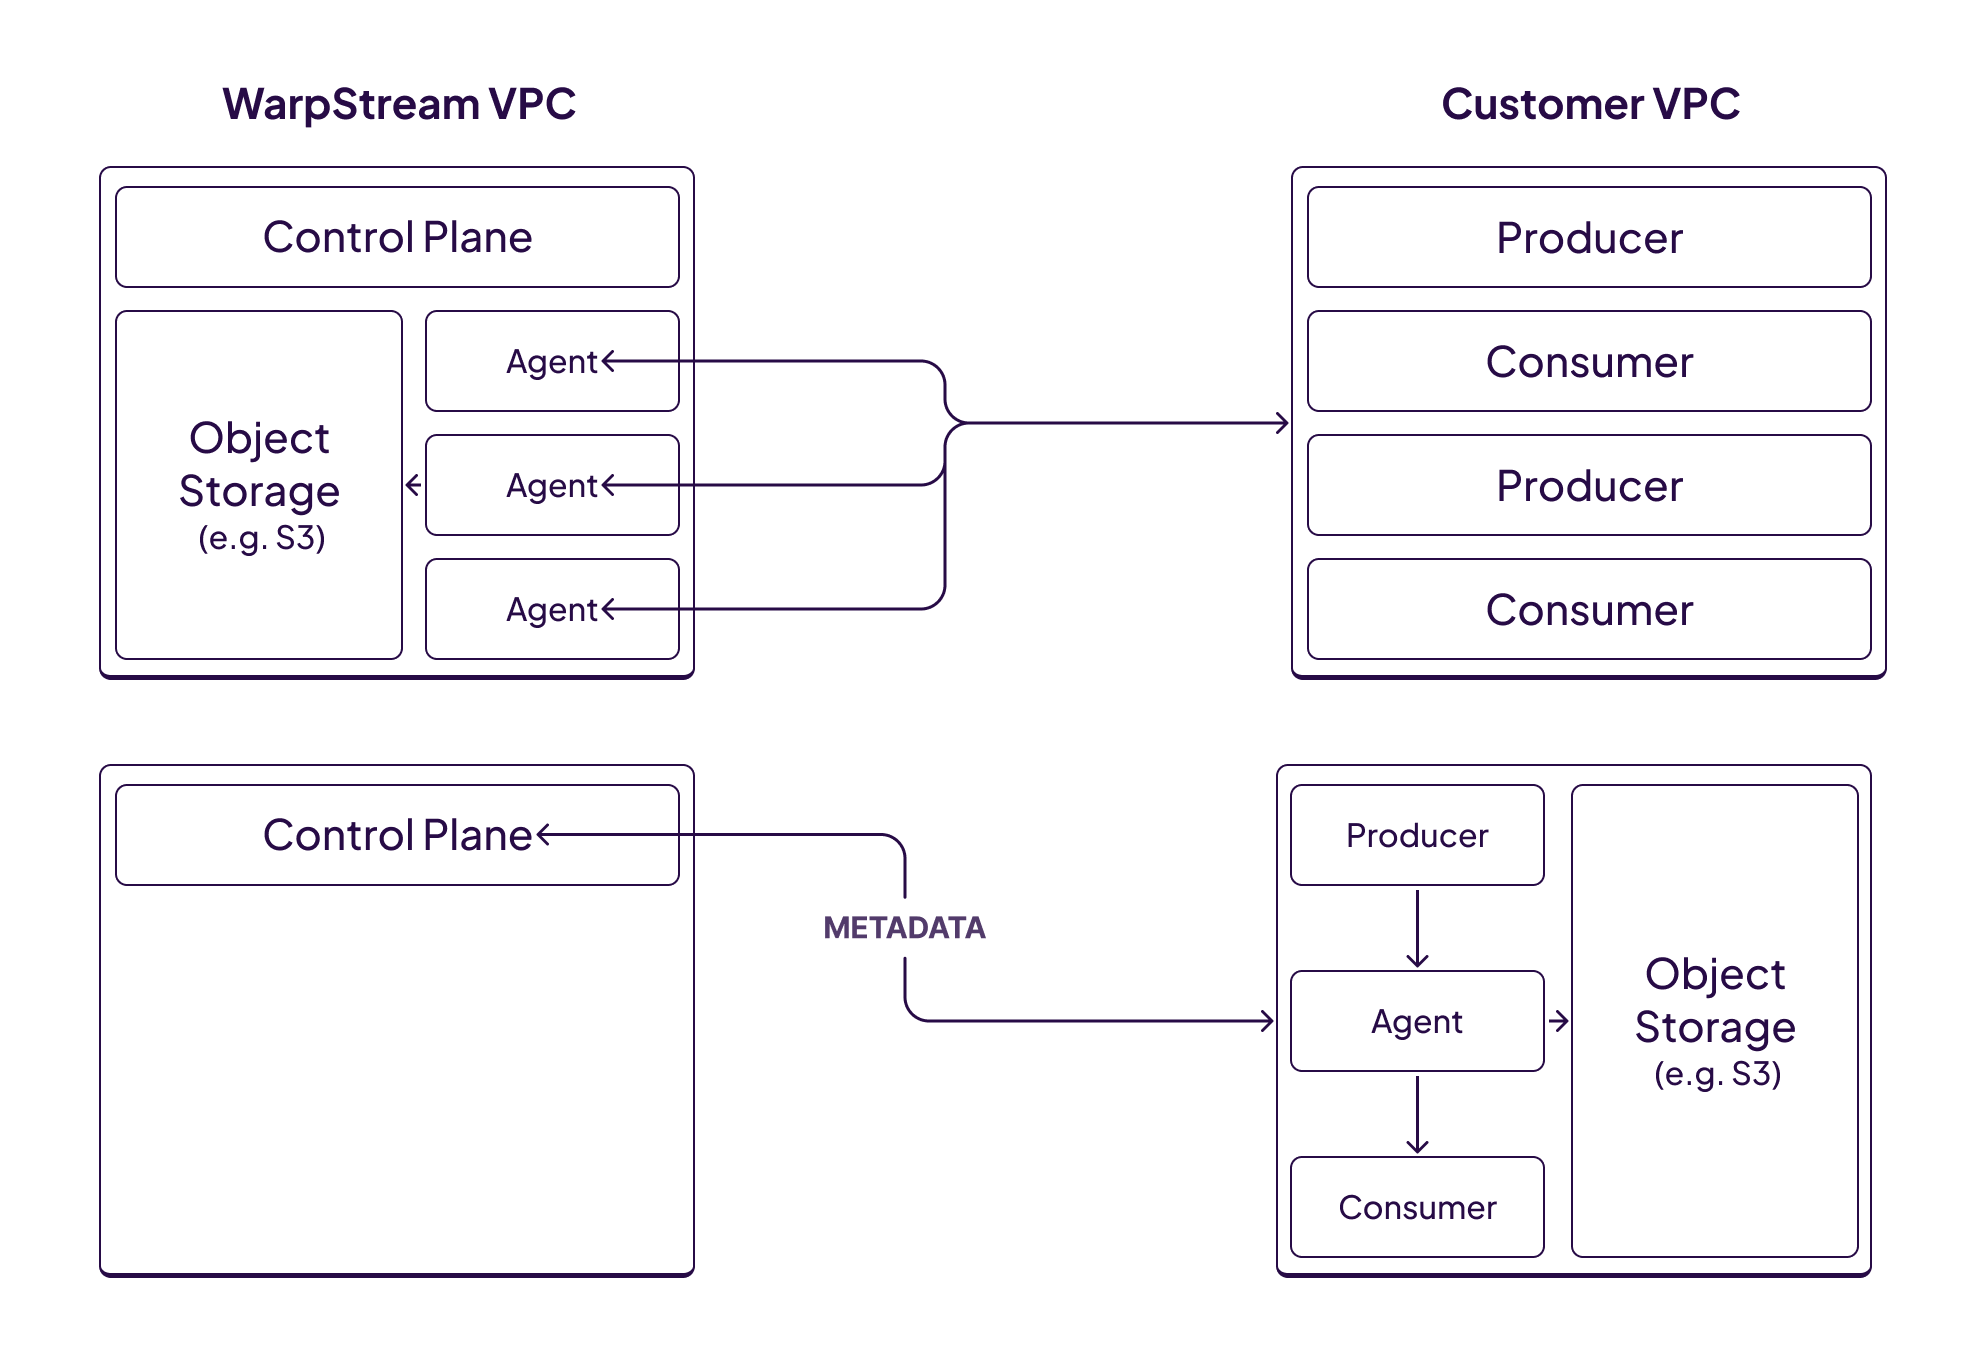
We account for the increased infrastructure costs we bear with the serverless product, and the value that our customers derive by not running this infrastructure themselves, by increasing our unit prices for write throughput and storage.
However, that wasn’t enough. The serverless product also needs to take into account network ingress and egress fees incurred by transmitting data through cloud environments. Specifically, cloud providers charge extra during ingress and egress for things like load balancers and cross-AZ networking when the consumers/producers are located in a different cloud account than the WarpStream Agents. Complicating the situation further, cloud egress fees heavily depend on whether the client is running in the same region as the server.
.png)
We wanted the pricing for our serverless tier to reflect automatically whether the client was running in the same region as the product. This meant that we had to implement a form of “network sensing” in our proxy tier.
The architecture of our serverless product looks something like this:
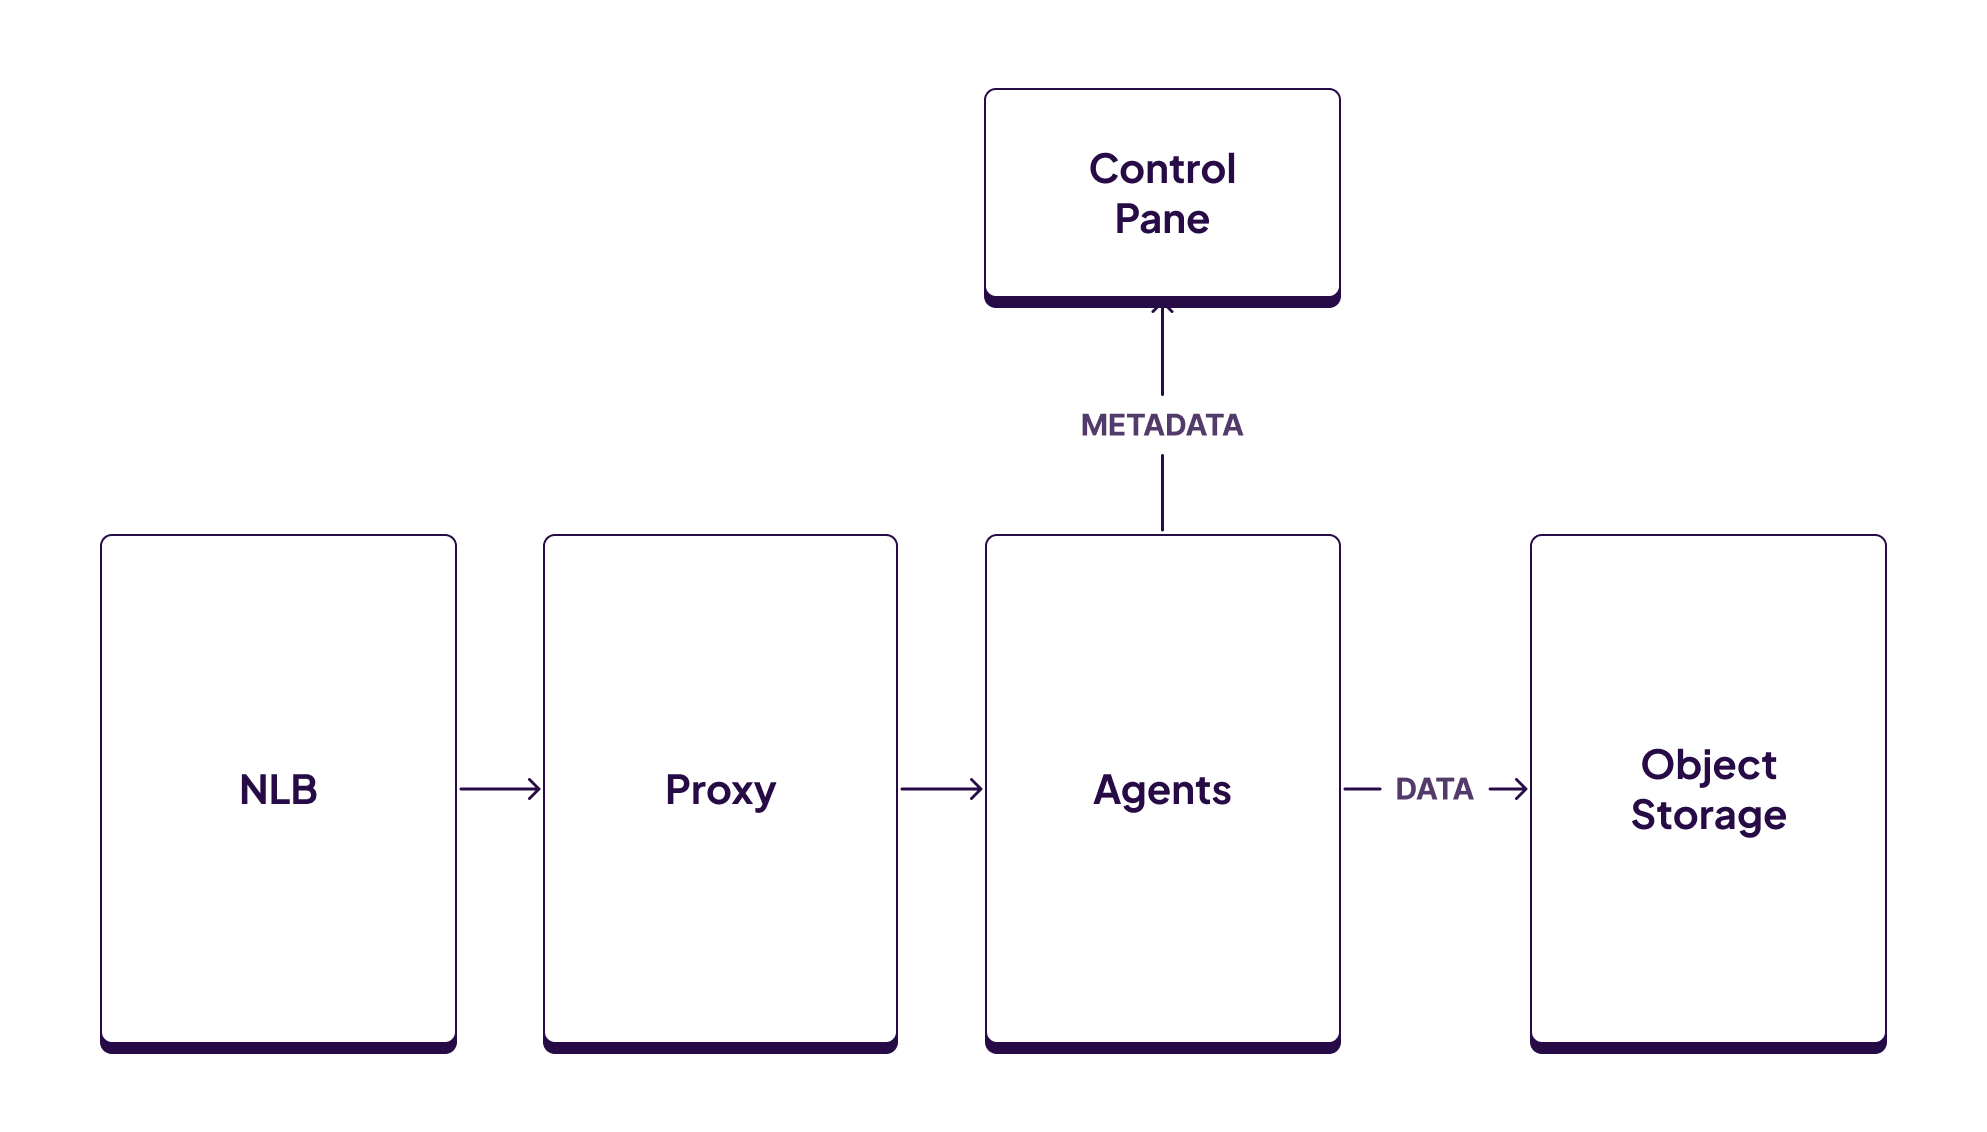
Clients connect directly to a network load balancer (NLB) managed by AWS that is responsible for load balancing and TLS termination. The NLB then proxies the connections to the WarpStream Proxy service which is a custom proxy we wrote that understands the Kafka protocol. The Proxy service is responsible for authenticating connections, and then routing them to the correct WarpStream Agents for a specific cluster.
Network ingress and egress should be measured at the Proxy layer, because that’s the service that clients interacting with directly via the Kafka protocol. It's also the only service that is directly exposed to the internet (via the NLB). Naively, we could emit a billing event for every Kafka protocol message we received, but that would result in millions of billing events per second for some individual workloads. We can spare ourselves most of that overhead.
Next, we considered batching at the connection level, and then emitting per-connection aggregated billing events at regular intervals. However, this would also result in an unacceptable amount of overhead for some workloads. It’s common for some poorly behaved Kafka clients to create tens of thousands or even hundreds of thousands of connections in a short period of time, even for relatively modest workloads.
Finally we settled on an in-memory two-tiered aggregation architecture, implemented entirely in the Proxy service itself. Each proxy connection would independently measure ingress/egress bytes on a per-connection basis and periodically submit aggregated events to an in-memory aggregator (sharded by tenant, running on the same Proxy node). The aggregator waits for a specific period of time, or a sufficient number of per-connection events, whichever comes first, and then flushes aggregated billing events to Orb.
.png)
With this approach, the number of billing events generated is O(m *n) where m is the number of tenants and n is the number of proxy nodes. Empirically, this resulted in a negligible amount of overhead. Performing the aggregation in-memory kept our overhead low, and the architecture simple, while still allowing us to lean on Orb’s pre-existing aggregation functionality for the final layer of aggregation. The primary downside with this approach is that there is a window of time where the billing data is not durable while it’s being aggregated in memory. We found this trade-off acceptable. The worst case scenario is that we’ll under-bill a customer when we unexpectedly lose a node.
Finally, we needed to perform “networking sensing” so we can detect if the client is running in the same region as the Proxy. The Proxy could look up the IP address of the connection source, but the traffic was being proxied via an AWS NLB and thus the IP addresses belong to the NLB, not to the client. Luckily AWS has a load balancer feature called “client IP preservation” which automagically preserves the client’s IP address even though the traffic was proxied through an NLB. Once we enabled that feature, the Proxy service had all the information it needed to detect whether the traffic source was in the same region or over the internet by consulting AWS’s published CIDR ranges for each region.
And just like that, we could meter all the traffic flowing in and out of our serverless service and submit all the required events to Orb!
Orb enabled us to implement this usage-based billing model in just a few days. If we had built the metering, rating, and invoicing logic ourselves, it would have taken weeks, possibly months, to implement. And we would have ongoing maintenance burdens and operational challenges with price changes in the future.
If you're interested in reducing your Kafka bill (and operational burden!) by 5-10x, check out our pricing page and book a demo!
